Interactive demo
The Sponsorlens dashboard. Live, in your browser.
Live Instagram & TikTok data, refreshed daily. Filter by sponsor, platform or period, the whole dashboard re-computes in real time.
Filters
Live · refreshed today
Total reach
13.8M
followers, IG + TikTok
Engagement rate
0.61%
weighted by audience
Media value (EMV)
€70,604
latest day, all accounts
Active sponsors
5
tracked daily
Social reach · millions
Reach over time
EMV · € millions
Value per platform
Per sponsor · reach (M) & engagement rate (%)
Engagement performance
Live data
Reach · millions of followers (log scale)
Engagement rate · %
Top posts · sorted by EMV
Best performing content
- #1If you’re going to play, play with fire. @carlitosalcarazz is back and coming iNike · Instagram (Reel)2.9M 367.5K 6KEMV€26,149
- #2The game looks different from here.Nike · Instagram (Reel)1.6M 203.7K 1.7KEMV€14,377
- #3Respectfully brutal. @bokrugby tough out a series only rugby’s greatest can prodNike · Instagram892.5K 111.6K 924EMV€7,874
- #4Discover how Emirates transformed retired aircraft parts into the iconic ArsenalEmirates · Instagram (Reel)794.9K 99.4K 485EMV€6,990
Measured insights
What the live data says
Live
- TikTok-first audienceTikTok audience is 14× Instagram for CA Osasuna (5.8M vs 415k), measured daily.
- Sponsor content underperformsSponsor-mentioning posts underperform organic content by 41% over 90 days.
- Untapped LED sponsors7 of 10 LED sponsors had zero owned-media activation in 90 days.
Match-day exposure
CA Osasuna vs Alavés · recorded broadcast POC
- KosnerLED2:01573 detections · 0.36% avg area
- NissanLED1:38215 detections · 0.38% avg area
- MacronJersey1:20226 detections · 0.2% avg area
- HalconLED1:03126 detections · 0.29% avg area
- DIGILED0:43203 detections · 0.17% avg area
- SanMiguelLED0:31231 detections · 0.18% avg area
- LexusLED0:1134 detections · 0.19% avg area
- DiarioNavarraLED0:0819 detections · 0.23% avg area
- TabarLED0:0612 detections · 0.16% avg area
- ToyotaLED0:0510 detections · 0.15% avg area
Measured on recorded public broadcast footage. Computer vision is in active development.
How it works
From raw broadcast to sponsor exposure data
- 01RecordPublic broadcast footage, sampled at 2 fps.
- 02DetectA YOLOv11 model fine-tuned on the club's sponsor logos.
- 03MeasurePer-sponsor screen time, share of voice, on-screen area.
- 04ReportStructured exposure data, ready for valuation.
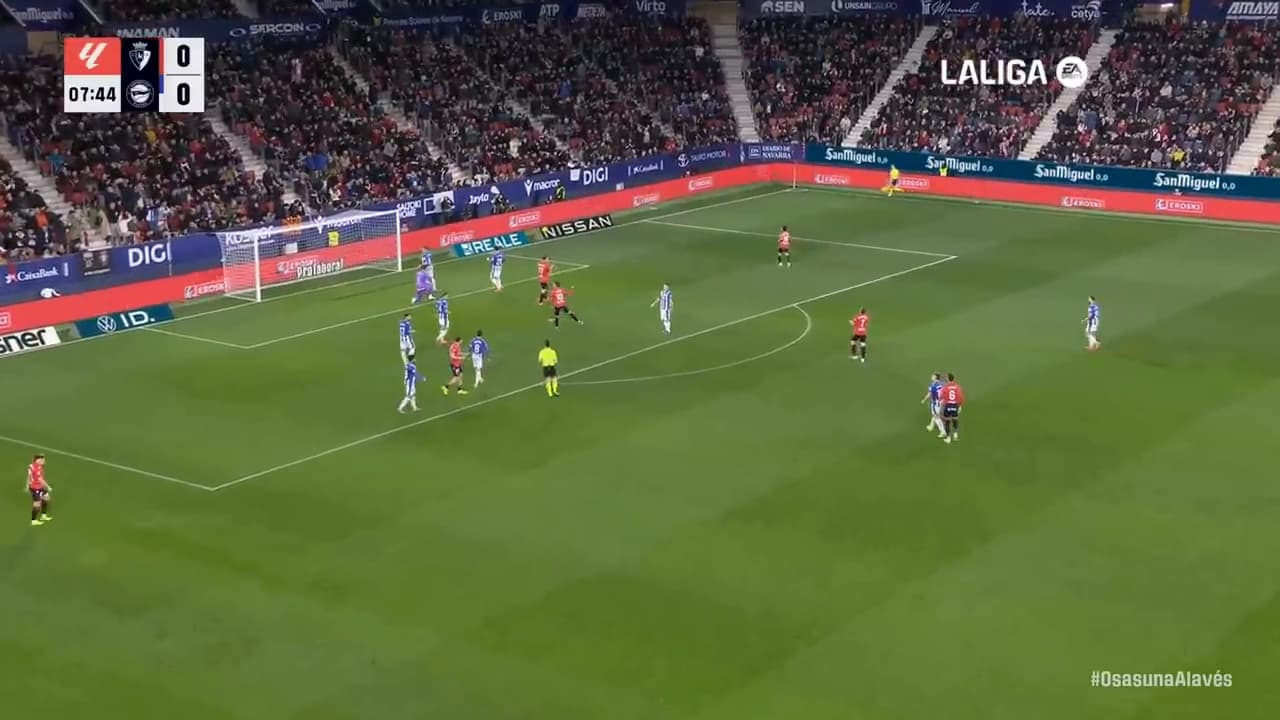
Each detection feeds the per-sponsor screen-time aggregation shown above.
Like what you see?
Get your own workspace in under 10 minutes, connect your channels, import your sponsor list, and start tracking today.